PHP性能优化工具篇Benchmark类调试执行时间_php实例_脚本之家
Benchmark工具类包说明
直接下载:http://pear.php.net/package/Benchmark/download
Benchmark工具类包共有三个文件,分别是Timer.php、Iterate.php和Profiler.php,三个工具类功能相同,只是侧重点不同,都是用于调试代码获取程序的执行时间。
1,Benchmark_Timer类原理与通过microtime函数获取微秒时间再比较前后两个时间值的差相同。
2,Benchmark_Iterate类用于调试函数的平均执行时间。
3,Benchmark_Profiler类用于统计代码和函数的执行时间以及函数的调用次数。
具体使用方法三个文件内都有详细的使用实例。
如何获取一行或一段代码的执行时间
1,通常使用microtime函数获取代码前后的微秒时间数再比较两个值的时间差,如下
- <?phpfunction microtime_float(){ list($usec, $sec) = explode(” “, microtime()); return ((float)$usec + (float)$sec);} $time_start = microtime_float(); usleep(100); $time_end = microtime_float();$time = $time_end – $time_start; echo “Did nothing in $time seconds\n”;?>
但这种方法很有局限制,不能大范围的应用,而且每次都需要书写很多代码,适合于简单的调试。具体请查看PHP手册详细说明。
2,通过使用benchmark_Timer类获取代码前后执行的时间差,可以同时获取N行代码的执行时间,操作简单,只需要增加一个marker标记即可,请看下面Benchmark_Timer类的使用说明
如何使用Benchmark_Timer类
Benchmark_Timer类只需要在调试文件中增加Benchmark_Timer类初始化声明和marker标注,文件尾打印各个标注处的执行时间,实例如下
- require_once ‘Benchmark/Timer.php’;$timer = new Benchmark_Timer();$timer->start();$timer->setMarker(“marker 01”);usleep(1);$timer->setMarker(“marker 02”);usleep(2);$timer->setMarker(“marker 03”);usleep(3);$timer->stop();$timer->display();
打印结果有两种方法:
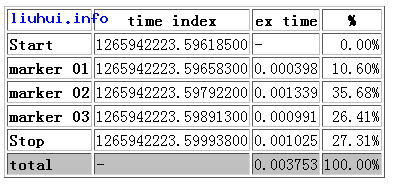
一种是表格输出方式,$timer->display(); 如下图
另外一种是手动var_dump或print_r打印,$timer->getProfiling();,print_r函数打印如下图
- array0 =>array’name’ => string ‘Start’ (length=5)’time’ => string ‘1265942405.31334800’ (length=19)’diff’ => string ‘-‘ (length=1)’total’ => string ‘-‘ (length=1)1 =>array’name’ => string ‘marker 01′ (length=9)’time’ => string ‘1265942405.31374400’ (length=19)’diff’ => string ‘0.000396’ (length=8)’total’ => string ‘0.000396’ (length=8)2 =>array’name’ => string ‘marker 02′ (length=9)’time’ => string ‘1265942405.31423000’ (length=19)’diff’ => string ‘0.000486’ (length=8)’total’ => string ‘0.000882’ (length=8)3 =>array’name’ => string ‘marker 03′ (length=9)’time’ => string ‘1265942405.31519200’ (length=19)’diff’ => string ‘0.000962’ (length=8)’total’ => string ‘0.001844’ (length=8)4 =>array’
name
- ‘ => string ‘Stop’ (length=4)’
time
- ‘ => string ‘1265942405.31623800’ (length=19)’
diff
- ‘ => string ‘0.001046’ (length=8)’
total
- ‘ => string ‘0.002890’ (length=8)
结果说明
1,name表示标注名称,如上 包含两个特殊标注start和stop表示开始和结束,其次是自定义标注 marker 01 marker 02等
2,time表示当前的微秒时间
3,diff表示上一个标记到当前标记的执行时间,这个就是我们需要获取的时间差,没错,看的就是这个值。
4,total表示执行到当前的整个时间
如何使用Benchmark_Iterate类
Benchmark_Iterate类用于调试函数执行的平均时间,与Benchmark_Timer类不同在于可以多次调用同一个函数获取其执行时间的平均值,实例如下:
- require_once “Benchmark/Iterate.php”;$bench = new Benchmark_Iterate;function test($i){ echo $i;}$bench->run(100,”test”,10);var_dump($bench->get());
通过调用test函数100次获取平均执行时间,结果如下
- array1 => string ‘0.000486’ (length=8)2 => string ‘0.000466’ (length=8)………………………..(中间省略)99 => string ‘0.000479’ (length=8)100 => string ‘0.000467’ (length=8)’
mean
- ‘ => string ‘0.000476’ (length=8)’
iterations
- ‘ => int 100
结果说明
1,每个数字表示每次调用的时间
2,mean表示函数执行的平均时间,如上调用100次test函数的平均时间为0.000476
3,iterations表示函数调用的次数
如何使用Benchmark_Profiler类
Benchmark_Profiler类用于统计函数的执行次数和执行时间等,实例如下:
- require_once ‘Benchmark/Profiler.php’;$profiler = new Benchmark_Profiler(TRUE);function myFunction() { global $profiler; $profiler->enterSection(‘myFunction’); //do something $profiler->leaveSection(‘myFunction’); return;}//do somethingmyFunction();//do more
结果如下
![]()

 微信扫一扫,打赏作者吧~
转载请注明:苏demo的别样人生 » PHP 使用Benchmark调试执行时间